 DataTwinLabs
Air quality analytics & forecasting
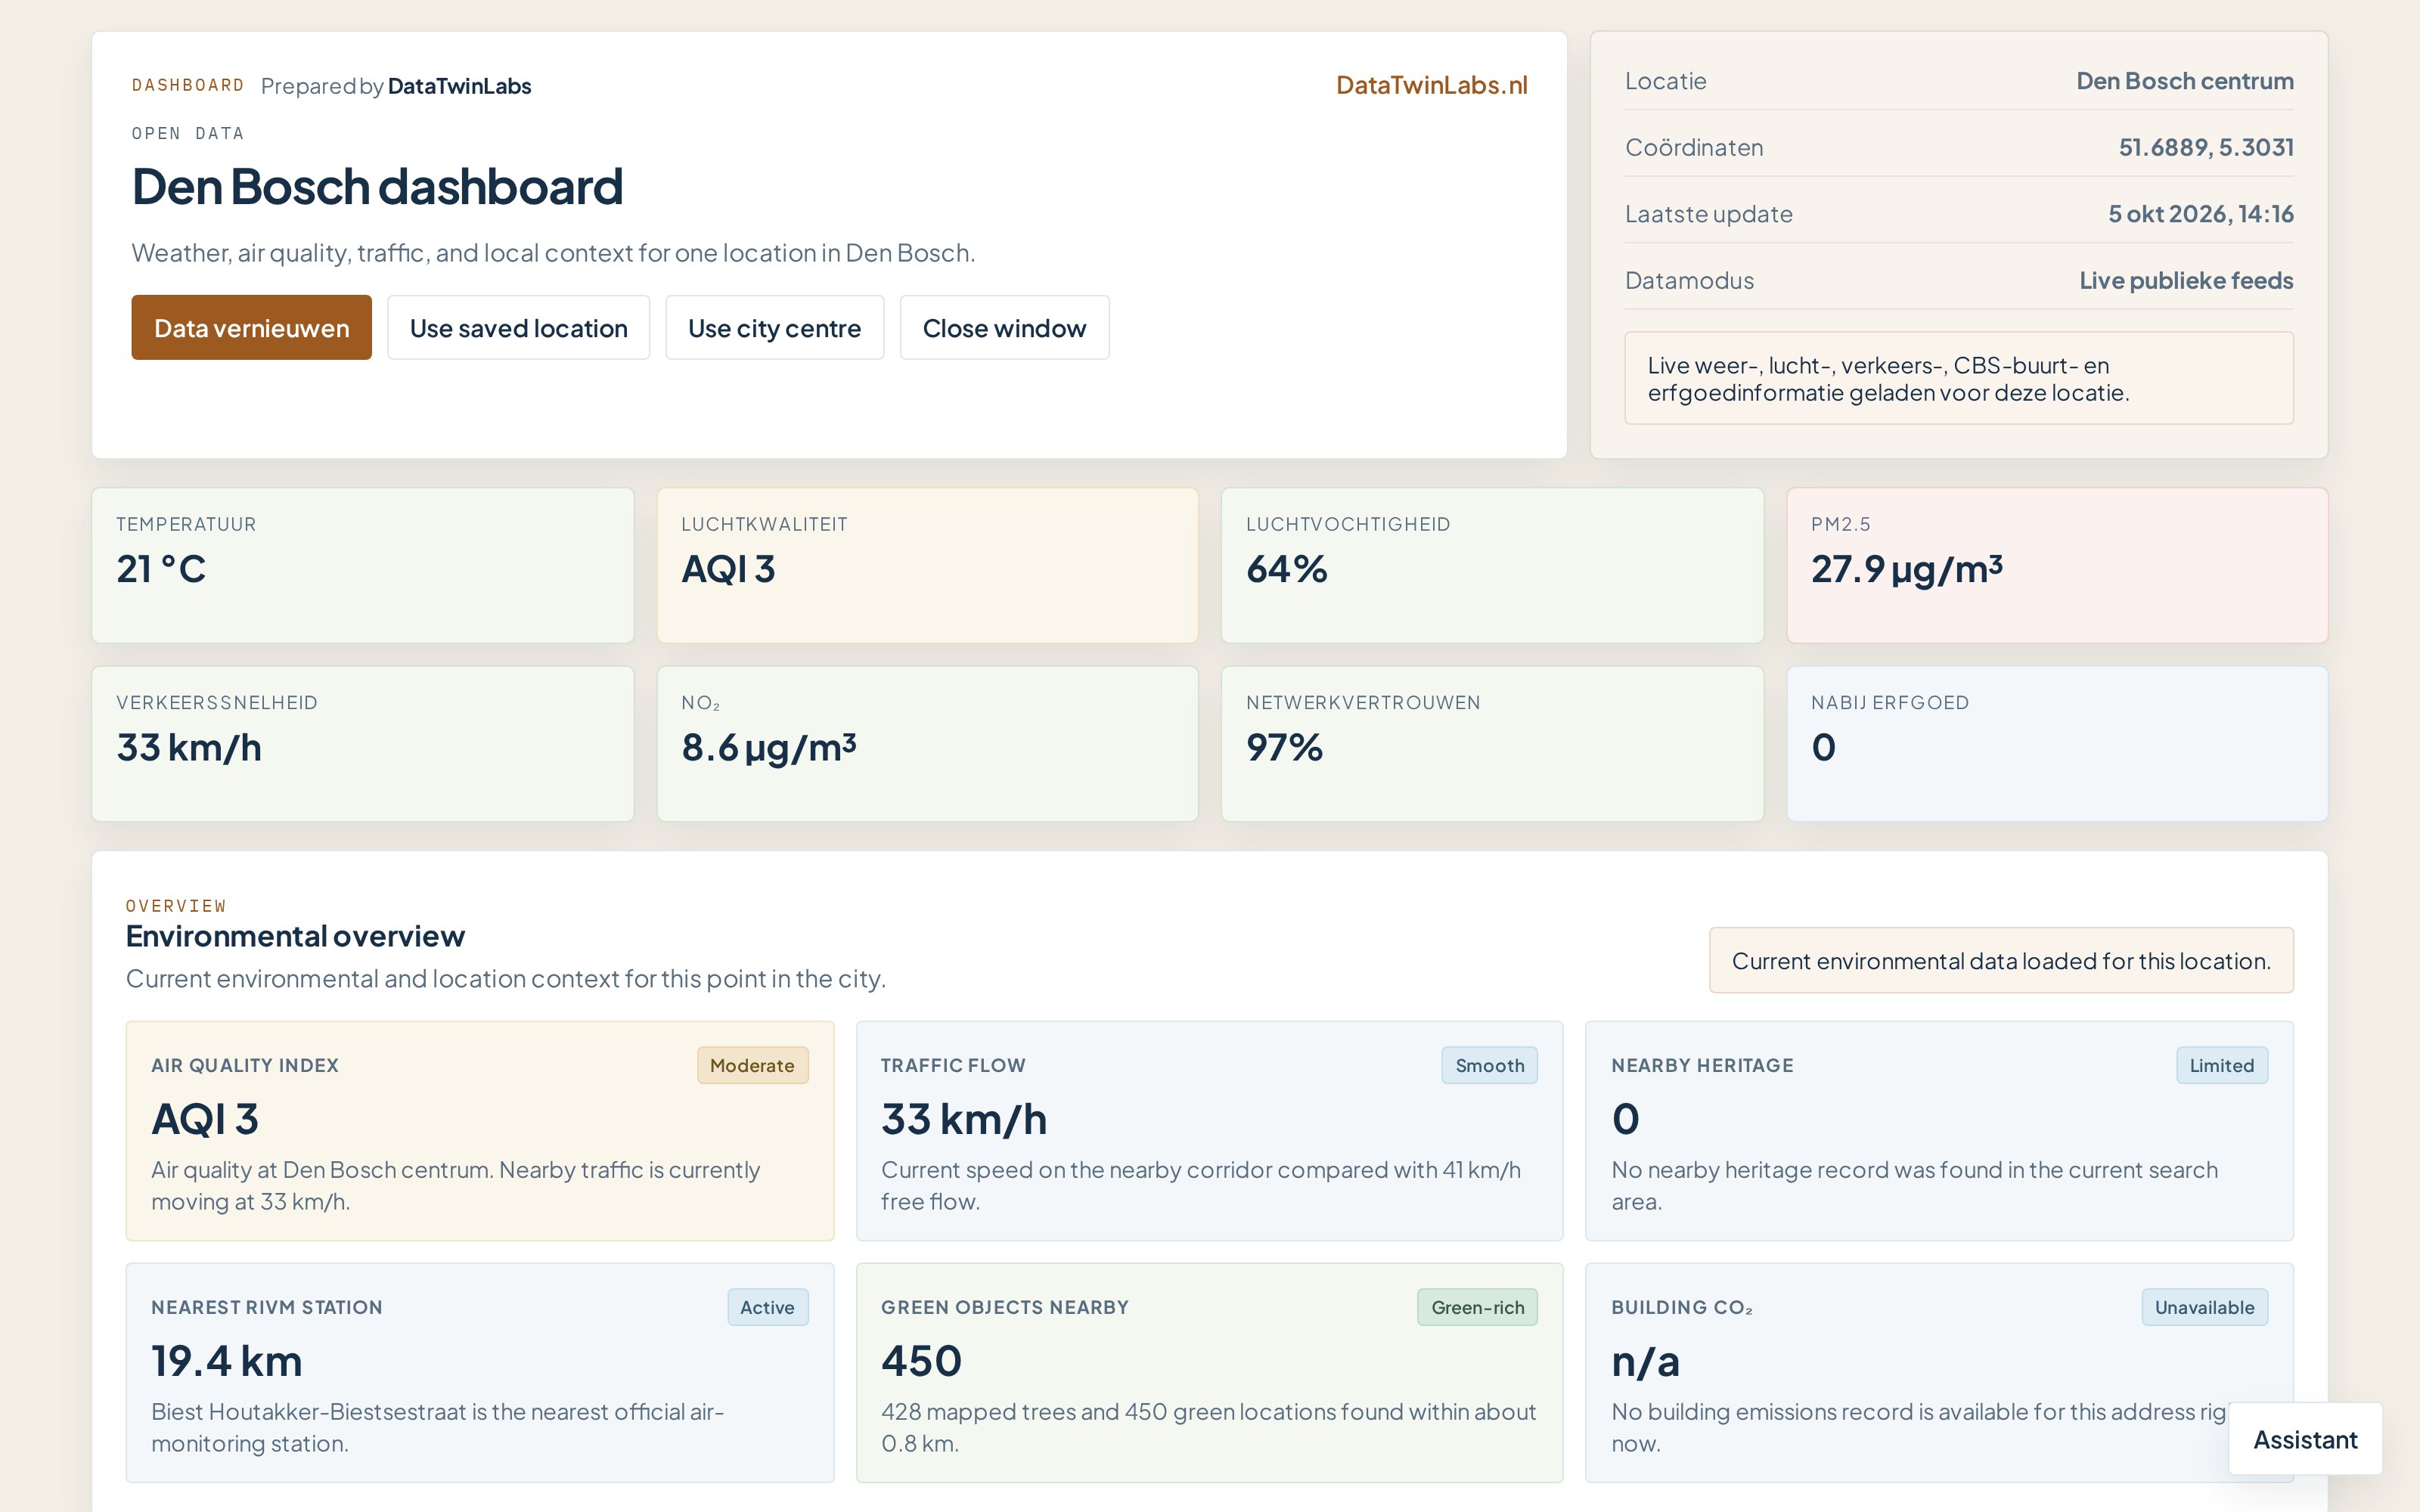
Sensor data cleaned, calibrated and modelled per neighbourhood, with PM2.5 and NO₂ trends next to the local forecast.
01 — The problem
Air measurements existed only as raw numbers per sensor, with gaps and drift. Nobody could see what they meant for a specific street.
02 — What I built
- ✦Time-series pipeline with gap filling, outlier detection and sensor calibration
- ✦Spatial aggregation of readings to neighbourhood level
- ✦Weather data joined in for context and short-term forecasting
- ✦Open-data dashboard readable without a data background
03 — What changed
Policy staff can see, per address, how the air has changed and what is expected next.
04 — Tools
PythonSQLPostGISAirflowOpenWeatherMapTypeScript
Next project
Energy demand forecasting